


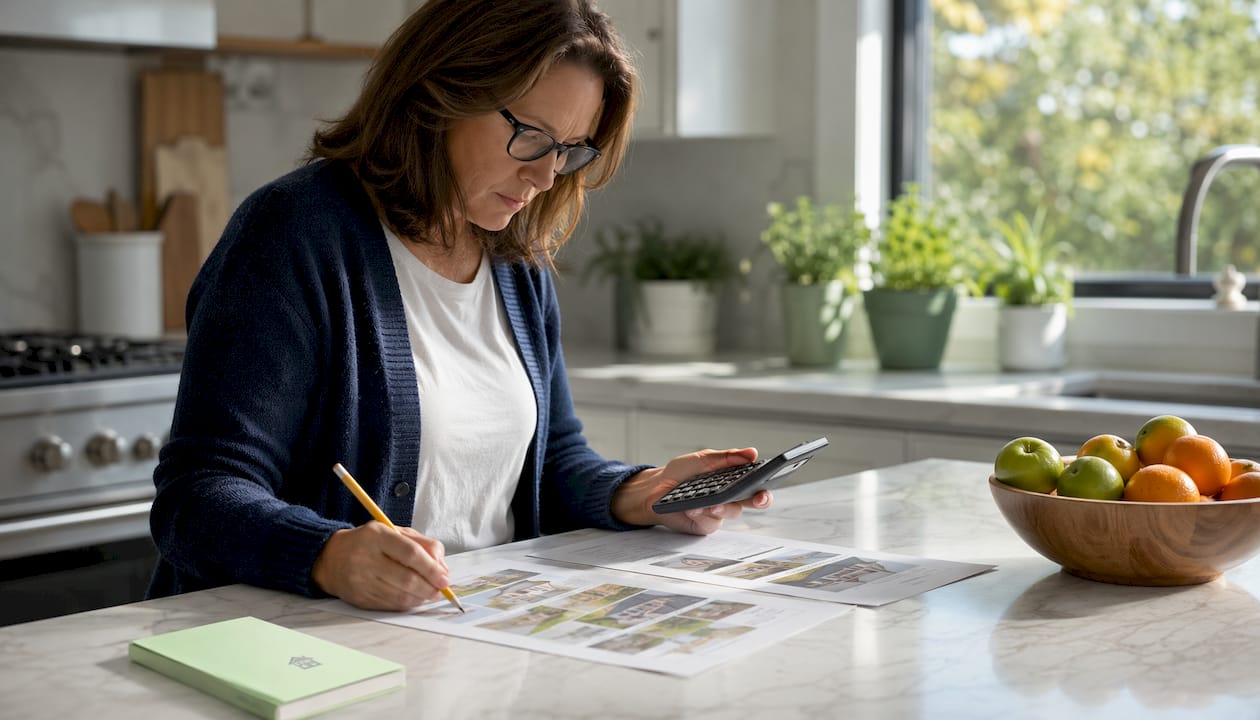
Price per square foot equals sale price divided by gross living area (GLA): Price ÷ GLA = $/sq ft. A home priced at $900,000 with 1,800 sq ft of GLA works out to a certain price per square foot. That single number lets you screen listings quickly, compare similar homes side by side, and track how a neighborhood’s values shift over time. It does not tell you whether the kitchen was remodeled, whether the lot backs up to a freeway, or whether the square footage was measured correctly. Those limits matter just as much as the formula itself.
Quick uses:
- Screen listings against neighborhood medians to spot outliers
- Compare two similar homes on an apples-to-apples basis
- Track price trends across a market over time
Quick limits:
- The number is only as reliable as the square footage behind it
- It ignores finish quality, lot value, views, and micro-location factors
Table of Contents
- What does “price per square foot” actually mean?
- How to calculate cost per square foot, step by step
- How to measure square footage correctly for valuation
- How to compare two properties fairly using $/sq ft
- Expert guidance on limits and where to find local benchmarks
- Two worked examples with full calculations
- Key Takeaways
- Why I don’t lead with $/sq ft — and when I do
- How Kennyhogan helps you get the numbers right
- Useful sources for local $/sq ft data
What does “price per square foot” actually mean?
The term refers to a home’s sale price (or list price) divided by its gross living area, the above-grade, finished, heated living space measured to ANSI Z765 standards. GLA is the denominator appraisers and lenders use because it captures the space a buyer actually lives in. The lot value is embedded in the sale price but never appears in the denominator, which is why two homes with identical GLA can have very different per-square-foot figures if one sits on a larger lot.
The metric works well within homogeneous neighborhoods and like-for-like property types. Comparing a 1,500 sq ft single-family home to a 1,500 sq ft Berkeley condo using the same $/sq ft benchmark will mislead you: condo fees, shared amenities, and land ownership structure all affect value in ways the ratio cannot capture. For luxury or custom homes, where unique finishes and one-of-a-kind features drive a large share of value, the metric becomes even less reliable as a standalone guide.
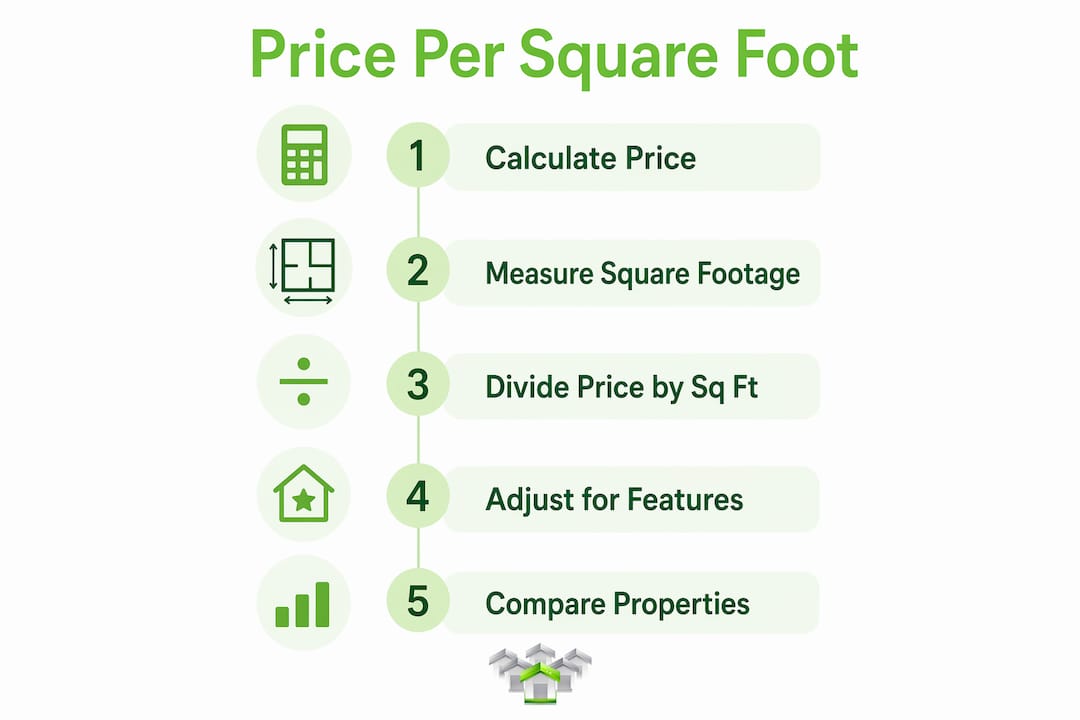
Market benchmarks vary widely: rural markets can sit in the $80–$120/sq ft range while coastal metros regularly exceed $500–$1,500+/sq ft. A national average is nearly useless. The only meaningful comparison is within the same neighborhood and property type.
How to calculate cost per square foot, step by step
-
Confirm the price you’re using. For a listed home, use the list price. For a sold home, use the recorded sale price. For a rental, use the monthly rent amount.
-
Confirm the square footage source and verify it’s GLA. The figure must represent above-grade, finished, heated living area measured to ANSI Z765. MLS entries, county assessor records, and builder spec sheets often differ from appraiser-measured GLA, sometimes by a meaningful margin.
-
Run the calculation. Divide the price by the GLA figure:
- Purchase: price divided by GLA equals the price per square foot
- Rental: monthly rent divided by GLA gives a rental rate per square foot per month
-
Gather comparables and compute the median. Pull five to ten recent sales of similar homes in the same neighborhood. Calculate $/sq ft for each. Use the median rather than the mean — a single outlier sale can skew an average significantly, while the median stays stable.
-
Set up a spreadsheet for batch processing. In a simple spreadsheet, place sale prices in column A and GLA figures in column B. Enter
=A2/B2in column C and drag it down. For the neighborhood median, use=MEDIAN(C2:C11). That summary figure becomes your benchmark. -
For rentals, note the difference in interpretation. Rental $/sq ft is a monthly rate, not a valuation metric. It helps compare lease options but should never be mixed with purchase $/sq ft figures.
How to measure square footage correctly for valuation
GLA, as defined by ANSI Z765 and required by Fannie Mae for appraisals with effective dates of April 1, 2022 or later, covers above-grade finished heated space. Staircases count in the GLA of the floor from which they descend. What does not count: garages, unheated porches, below-grade basements (even finished ones), and any space that fails the minimum ceiling height threshold.
Common square footage sources and their reliability
| Source | What it typically measures | Reliability for GLA |
|---|---|---|
| Appraiser measurement (ANSI Z765) | Above-grade GLA only | Highest — use for valuation |
| MLS listing entry | Agent-reported; may include basement | Moderate — verify against appraisal |
| County assessor records | Varies by jurisdiction; often includes garage or basement | Low — use as a starting point only |
| Builder spec sheet | Total finished area, sometimes including below-grade | Low — can overstate GLA by 5–15% |
For verification, a laser distance measurer ($30–$80) gives very high accuracy for a DIY check. A professional appraiser measurement runs $400–$600+ and is worth ordering when a transaction is large or the listing square footage looks inflated. At $400/sq ft, a 100 sq ft measurement error equals a $40,000 difference in implied value — a number that puts the cost of verification in perspective.
Pro Tip: When reviewing a listing, check whether the square footage matches the floor plan sketch. If no sketch is provided, or if the figure includes “finished basement” in the description, treat the number as unverified GLA and request the appraiser’s measurement before making an offer.
How to compare two properties fairly using $/sq ft
Raw $/sq ft comparisons mislead when homes differ in size, type, or features. A few adjustments make the comparison meaningful.

Bracketing by size. Smaller homes command a higher $/sq ft than larger ones in the same market — a 900 sq ft cottage might trade at $350/sq ft while a 3,000 sq ft home in the same neighborhood sits at $220/sq ft. That gap reflects declining marginal value, not overpricing. Limit your comparables to homes within roughly ±15–25% of your subject property’s GLA to avoid this size bias.
Adjusting for non-GLA living space. A finished basement adds value but does not belong in the GLA denominator. Appraisers typically value finished below-grade space at a percentage of the above-grade rate, and ADUs should be valued separately rather than folded into the GLA calculation. When comparing two homes where one has a finished basement and the other does not, note the difference explicitly rather than blending it into the $/sq ft figure.
Separating lot and location premiums. A corner lot, a view, or a top school district adds to the sale price without adding to GLA. Folding those premiums into a $/sq ft comparison distorts the picture. Identify them, note them separately, and adjust your interpretation accordingly.
Watch for these common pitfalls:
- Comparing single-family homes to condos using the same benchmark
- Using assessor square footage without verifying it against GLA
- Treating $/sq ft as a final valuation rather than a screening filter
- Ignoring multi-unit property differences, where income potential affects value in ways GLA cannot capture
Expert guidance on limits and where to find local benchmarks
Experienced agents treat $/sq ft as a screening tool, not a valuation method. The workflow is: use it to flag outliers, then run a full comparative market analysis (CMA). That distinction matters in practice.
Appraisers go further. Rather than applying the neighborhood’s raw $/sq ft as an adjustment, they use paired-sales analysis — selecting two comparable sales that differ primarily in GLA and deriving the dollar-per-square-foot adjustment from that pair. The resulting adjustment rate is typically lower than the raw market $/sq ft, because marginal square footage is worth less than core square footage.
What $/sq ft cannot tell you:
- Finish quality (original 1960s kitchen vs. full renovation)
- Views, natural light, or lot orientation
- School district boundaries that split a single block
- HOA fees or deferred maintenance
- How interest rate trends are shifting buyer demand in a specific price band
Where to find reliable local benchmarks:
- MLS sold data filtered by neighborhood, property type, and size band (most accurate)
- County recorder/assessor sales files (free, but verify GLA)
- FRED (Federal Reserve Bank of St. Louis) for national and metro-level median list price per square foot trends
- Zillow and Redfin as starting points — useful for direction, but always verify the GLA behind the figures
Pro Tip: Request the appraiser’s GLA figure from the seller’s disclosure or the prior appraisal report before finalizing any offer. If none is available, budget for an independent measurement — especially in Berkeley, where older Craftsman and Victorian homes often have finished attic space or converted garages that public records count inconsistently.
Two worked examples with full calculations
Example A: Two single-family homes, same neighborhood
Home 1 sold at a certain price with 1,960 sq ft GLA resulting in a given price per square foot. Home 2 sold at a higher price with 1,800 sq ft GLA resulting in a higher price per square foot.

You pull several recent comparables in the same neighborhood and compute a median price per square foot. Home 1 is at the median price per square foot among comparables. Home 2 is priced noticeably above it. Before concluding Home 2 is overpriced, check: Was it recently renovated? Does it have a larger lot? Is the GLA verified? The $/sq ft gap flags it as an outlier worth investigating, not a definitive verdict.
Example B: Finished basement adjustment
Home A sold for a certain price with 1,700 sq ft GLA (no basement). Home B sold for a slightly higher price with the same GLA plus a finished basement, yielding a similar price per square foot if the basement is excluded from GLA.
If the listing for Home B incorrectly includes the basement in the GLA figure, the price per square foot drops significantly, making it look like a bargain when it is actually priced at a premium for the above-grade space. Separating the basement value (typically at a lower rate per sq ft than GLA) and comparing only the GLA-based figures gives you an honest comparison.
Follow-up questions to ask after running the math:
- What is the median $/sq ft for homes in the 1,600–2,000 sq ft GLA range in this neighborhood?
- Has the listing’s square footage been verified by an appraiser, or is it agent-reported?
- Does the comparable set include any homes with finished basements or ADUs that inflate the denominator?
- How do minor renovations affect the $/sq ft of recently sold comparables?
Key Takeaways
Price per square foot is a reliable screening tool when you use verified GLA, bracket comparables by size, and treat the median as your benchmark — not the final word on value.
| Point | Details |
|---|---|
| Use verified GLA only | Always confirm square footage is appraiser-measured GLA per ANSI Z765, not assessor or builder figures. |
| Median beats mean | Compute the median $/sq ft across comparables to avoid distortion from outlier sales. |
| Bracket by size | Limit comparables to ±15–25% of your subject property’s GLA to correct for size bias. |
| Value basements separately | Finished below-grade space should be noted and valued apart from GLA, not blended into the denominator. |
| Kennyhogan for local context | Kennyhogan provides GLA verification, CMA analysis, and neighborhood-specific $/sq ft benchmarks across Berkeley and the Greater Bay Area. |
Why I don’t lead with $/sq ft — and when I do
Most buyers arrive at a listing with a $/sq ft figure already in mind, pulled from Zillow or a quick search. That number is often built on unverified square footage, and in Berkeley’s market, the gap between assessor records and appraiser-measured GLA can be substantial. A Craftsman with a finished attic counted as GLA in the MLS but excluded by an appraiser will look like a different property depending on which figure you use.
My workflow starts with $/sq ft as a filter, not a conclusion. If a listing sits more than 10–15% above the neighborhood median for its size band, I want to know why before I advise a client on price. Sometimes the answer is a recent full renovation, a premium lot, or a view corridor that genuinely justifies the gap. Sometimes it’s inflated square footage. The metric tells me which question to ask, not what the answer is.
In Berkeley specifically, lot premiums, ADU potential, and view corridors can move a sale price by hundreds of thousands of dollars without adding a single square foot of GLA. Folding those factors into a $/sq ft comparison produces a number that looks precise but means very little. The clients I serve best are the ones who understand that distinction before they make an offer.
How Kennyhogan helps you get the numbers right
Knowing the formula is one thing. Knowing whether the square footage behind it is accurate, and whether the comparable set is genuinely comparable, is where local expertise makes a real difference.

Kennyhogan provides residential real estate services across Berkeley and the Greater Bay Area, including GLA verification, full comparative market analysis, and neighborhood-specific $/sq ft benchmarks. For buyers, that means going into an offer with confidence that the price reflects what you’re actually getting. For sellers, it means a listing strategy grounded in verified data, not portal estimates. First-time buyers especially benefit from having an agent who can walk through the numbers before the offer deadline arrives. Contact Kennyhogan to request a local market check or a CMA for a specific property.
Useful sources for local $/sq ft data
| Source | Primary use | Reliability |
|---|---|---|
| ANSI Z765 (via Fannie Mae guidance) | GLA measurement standard for appraisals | Authoritative — the governing standard |
| FRED (St. Louis Fed) | National and metro median list price per sq ft trends | High — primary market data |
| MLS sold data | Neighborhood-level comps with verified GLA | Highest for local benchmarks |
| County assessor records | Starting point for ownership and size data | Low — verify GLA before using |
| Zillow / Redfin | Market direction and listing history | Moderate — treat as a starting point |
| Professional appraiser | Property-specific GLA measurement and valuation | Highest for individual property decisions |
For the ANSI Z765 measurement standard, Fannie Mae’s published guidance is the primary reference. For national and metro-level median list price per square foot, the FRED database provides regularly updated series. For any individual property decision, an appraiser-measured GLA figure and a locally sourced CMA remain the most reliable inputs available.
This article is general information, not professional appraisal or legal advice. Confirm current measurement standards and local market conditions with a licensed appraiser or qualified real estate professional for your specific situation.
Recommended
- 7 Minor Renovations That Will Boost Your Southwest Berkeley Home Value Before Selling – Kenneth Hogan Realtor – Compass
- Predicting Future Interest Rate Trends in the Real Estate Market – Kenneth Hogan Realtor – Compass
- How to Navigate Fluctuating Interest Rates as a Homebuyer or Seller – Kenneth Hogan Realtor – Compass
- Blog – Kenneth Hogan Realtor – Compass