


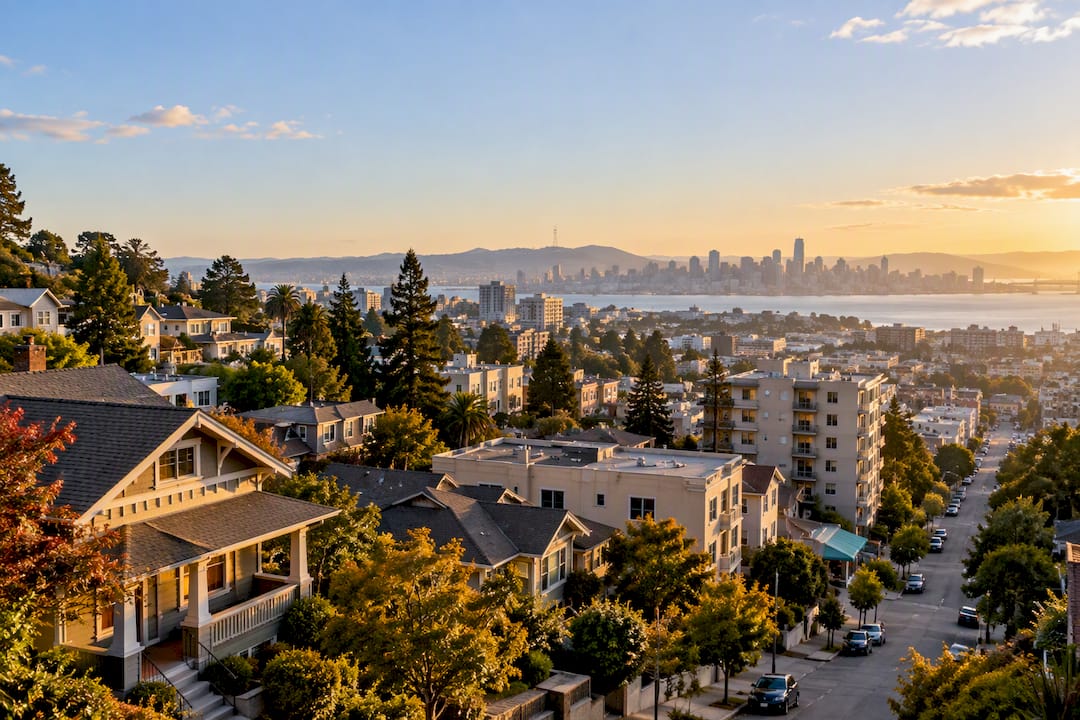
Oakland’s typical home value sits at roughly $716,000, down about 11.4% from a year ago according to Zillow data reported in May 2026, making it one of the steepest year-over-year declines in the country. At the same time, active listings remain tight and homes are still moving fast, which tells a more complicated story than a single headline number. The sections below break down the data, the neighborhoods bucking the trend, and what it means if you’re buying or selling right now.
TL;DR:
- Property mix and neighborhood-specific demand heavily influence local prices, with wealthier areas like Crocker Highland and Montclair remaining resilient.
- Fewer active listings and aggressive price cuts in certain sectors, like condos and distressed properties, are driving the overall decline more than actual sales.
- Price drops vary significantly depending on data sources, with Zillow indicating an 11.4% annual decline while Realtor.com reports only a 3.3% decrease.
- Buyers should focus on neighborhood-level comps and get pre-approved early, while sellers need to price based on recent local sales rather than citywide statistics.
- Long-term, Oakland’s values remain higher than a decade ago, but recent rapid rate hikes have compressed the timeline for price stabilization and correction.
Table of Contents
- Oakland Home Value: Current Snapshot
- Why Oakland Home Values Are Falling
- Oakland Neighborhoods: Where Values Hold and Where They’ve Slipped
- What Buyers and Sellers Should Do Right Now
- How Home Values Get Measured, and Where the Numbers Diverge
- A Local Read on the Oakland Market
- Oakland’s Home Values Over the Longer Run
- Development and Infrastructure: The Slow-Moving Value Driver
- Oakland vs. the Wider Bay Area Market
- How Jobs and Income Shape Oakland Home Values
- Condos, Multi-Family, and Townhouses: Not All Property Types Move Together
- Ready to Act on Oakland’s Market? Here’s Our Take
- Sources
- FAQ
Oakland Home Value: Current Snapshot
Numbers depend heavily on which source you check and when. Altos, Zillow, and Realtor.com all measure Oakland’s market slightly differently, and their snapshots from the past few months tell a consistent but nuanced story: prices are softening, but the market hasn’t loosened up the way falling prices might suggest.
Realtor.com’s data shows Oakland’s median list price slipped slightly year-over-year, well short of Zillow’s 11.4% figure. That’s a wide gap, and it matters. Oakland’s median list price still runs about 55% above the national median, so even with a real correction underway, this isn’t a market in freefall. It’s a Bay Area market recalibrating from a much higher baseline than most of the country.
Why Oakland Home Values Are Falling
Three forces are doing most of the work here, and none of them point to a single simple explanation.
Mortgage rates remain the biggest drag on affordability. Buyers who qualified for a certain payment two years ago now qualify for meaningfully less house at today’s rates, which pushes offers down even when a seller’s asking price hasn’t moved. That pressure shows up first in year-over-year value comparisons like Zillow’s.
Inventory tells a more surprising story. Realtor.com found active listings actually fell to around 554 in May, not the flood of supply you’d expect during a price decline. Fewer listings paired with more price cuts on the homes that are listed pulls the median down even as competition for well-priced homes stays real.
The property mix matters just as much as either factor above:
- Condo-heavy zip codes are dragging the citywide median lower, since condos have softened more than single-family homes in most Bay Area cities recently.
- A handful of high-value single-family sales can offset dozens of smaller declines, which is why neighborhood-level data often looks calmer than the citywide number.
- Distressed or long-sitting listings get repriced more aggressively, and those repricings show up disproportionately in year-over-year percentage changes.
Statistic Callout: The often-cited ~11% drop comes from Zillow’s typical home value index. Realtor.com’s list-price data for the same window shows a much smaller 3.3% slip, a reminder that “Oakland home values fell 11%” and “Oakland home values fell slightly” can both be technically true depending on which index you’re reading.
Oakland Neighborhoods: Where Values Hold and Where They’ve Slipped
Oakland isn’t one housing market. It’s a patchwork of dozens of them, and the citywide median can mask real differences from one hillside to the next.
- Crocker Highland and Panoramic Hill rank among Oakland’s wealthiest enclaves, with Crocker Highland’s median household income near $238,126, according to HomeSnacks, and home values well above the city median.
- Montclair and Rockridge continue to draw buyers who want walkable retail and stronger school reputations, keeping single-family demand resilient even as citywide figures dip.
- Flatland neighborhoods with more condo inventory and higher shares of distressed or long-listed properties have seen the sharpest median declines, disproportionately pulling the citywide average down.
If you’re pricing a home or comparing offers, the citywide median is a starting point, not an answer. The Terner Center’s research makes this point directly: the Bay Area isn’t a single market, and treating it that way leads to bad pricing decisions on both sides of a transaction. A neighborhood-specific listing search tells you far more than any citywide percentage ever will.
What Buyers and Sellers Should Do Right Now
The dip in headline values changes the calculus for both sides, but not in the way most people assume.
If you’re buying:
- Get fully pre-approved before you start touring homes. In a market where homes still spend a median of 39 days on the market, hesitation costs you the good ones.
- Narrow your search to two or three target neighborhoods and study their actual sold comps, not the citywide median.
- Build offers around recent comparable sales, not around the 11% headline. A citywide statistic doesn’t tell you what the three-bedroom on your target street actually sold for last month.
If you’re selling:
- Price to current neighborhood comps, not to what your home might have fetched at the market’s 2022 peak.
- Invest in the staging and prep work that actually moves buyer perception, since tighter inventory means well-presented homes still attract multiple looks.
- Time your listing around neighborhood-level demand rather than citywide headlines. A hillside single-family market can be tight even while a condo-heavy flatland zip code is soft.
Pro Tip: A declining citywide median is often a buying opportunity in strong neighborhoods and a warning sign in weaker ones. The same headline number means two very different things depending on where you’re looking, so always check the specific area before you act on it.
For first-time buyers navigating this environment, working through financing and offer strategy with a dedicated first-time buyer program tends to prevent the costliest mistakes.
How Home Values Get Measured, and Where the Numbers Diverge
Every headline number comes from a different measuring stick, and knowing which one you’re reading matters.
- Zillow’s ZHVI (Zillow Home Value Index) estimates a typical home’s value across the entire housing stock, including homes that haven’t sold recently, using an algorithm based on sales, tax data, and comparable listings.
- Altos tracks active listing prices in near real time, giving a faster read on where sellers are pricing homes today, without waiting for sales to close and get recorded.
- Realtor.com blends active listing data with market-pace metrics like days on market, which is why its list-price change often differs from Zillow’s value-index change.
Each carries caveats: housing-type mix skews averages, reporting lags mean the “current” figure is often weeks old, and none of these indices know the condition of your specific kitchen or roof. For an actual pricing decision, a comparative market analysis built from recent sold comps, adjusted for size, lot, and condition differences, beats any citywide index every time.
A Local Read on the Oakland Market
Twenty years of working Bay Area residential transactions teaches you one thing above all: citywide headlines are a starting point for a conversation, not a pricing tool. It’s two different lenses on the same market, and the truth for your specific block sits somewhere in that gap, shaped by housing type, condition, and neighborhood demand.
Three situations usually mean it’s time to call an agent rather than rely on an app’s estimate:
- Your neighborhood shows a sharp move in either direction compared to the citywide trend.
- A distressed or underpriced listing appears in a neighborhood you’ve been watching.
- You’re facing a life event, retirement, relocation, or growing family, that puts a real timeline on your decision.
Oakland’s Home Values Over the Longer Run
Oakland’s home values have moved through several distinct cycles over the past two decades, and the current dip looks different depending on how far back you compare it. Values climbed steeply through the mid-2010s as Bay Area tech growth pushed buyers priced out of San Francisco across the estuary. That run continued, with brief pauses, through the pandemic-era surge when remote work sent buyers hunting for more space at what still felt like a discount compared to San Francisco proper.
Measured against a five or ten-year window, Oakland home values remain sharply higher than they were a decade ago, even after this correction. Corrections following unusually steep gains aren’t unusual. They’re closer to the norm.
What’s different this time is the compressed timeline. Rate increases hit affordability faster than past slowdowns, which compressed years of typical cooling into a shorter, sharper adjustment. Long-time owners who bought before 2020 are, in almost every case, still sitting on substantial equity gains despite the recent dip. That context matters enormously for sellers trying to decide whether now is a reasonable time to list, versus buyers hoping this signals a return to pre-2015 pricing. It doesn’t, at least not yet.
Development and Infrastructure: The Slow-Moving Value Driver
Price indices move month to month. Infrastructure and development shift value over years, and Oakland has several projects worth watching if you’re thinking beyond the next two quarters.
Transit-adjacent development near existing BART stations continues to reshape demand patterns in neighborhoods like West Oakland and Fruitvale, where new housing stock and improved walkability tend to support values even when citywide numbers soften. Downtown and Jack London Square have absorbed years of mixed-use residential construction, and that added condo supply is part of why condo-heavy areas show softer pricing right now. More units competing for the same buyer pool suppresses per-unit appreciation in the short term, even as it improves neighborhood amenities long-term.
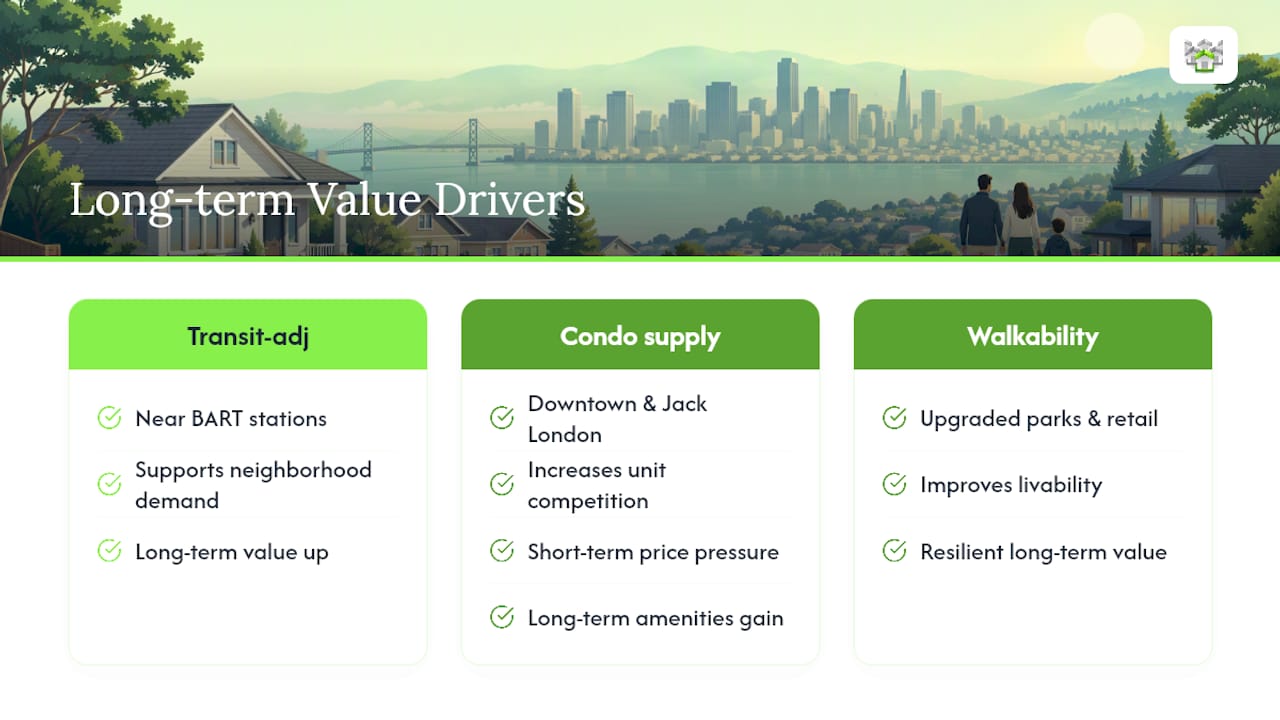
Public investment in waterfront and park improvements tends to move slower than the market news cycle, but it compounds. Neighborhoods that saw meaningful infrastructure investment a decade ago, better transit access, new retail corridors, upgraded parks, are consistently among the areas that held value best through this current correction. If you’re evaluating a neighborhood for a long-term hold, current listing activity matters less than what’s been approved and funded for the next three to five years.
Oakland vs. the Wider Bay Area Market
Oakland’s decline looks more dramatic in isolation than it does next to its neighbors. The wider Bay Area has softened broadly, not just in Oakland, as the same rate pressure and affordability squeeze hit San Francisco, the Peninsula, and the East Bay simultaneously.
What sets Oakland apart is the size of the reported drop relative to nearby markets. Richmond, for instance, has a lower price base and has generally seen smaller percentage swings, since there’s less room for the kind of condo-driven distortion pulling Oakland’s median down. San Francisco’s ultra-high price point makes its percentage changes look smaller even when dollar-value swings are larger. Oakland sits in an awkward middle position: expensive enough that rate increases hit affordability hard, but with enough condo and multi-unit inventory that housing-type mix swings the median more than in single-family-dominated suburbs.
The broader Bay Area housing data shows this isn’t an Oakland-specific problem. It’s a regional affordability correction landing unevenly, and Oakland’s mix of housing types happens to amplify the headline number more than most.
How Jobs and Income Shape Oakland Home Values
Home values don’t move in a vacuum. They track what buyers can actually afford to pay, and that’s a function of local employment and income trends as much as mortgage rates.
Oakland’s economy leans heavily on its proximity to San Francisco’s job market, along with its own healthcare, logistics, and public-sector employment base. When tech hiring slows or shifts remote, it reduces the pool of high-income buyers who historically pushed up bidding in neighborhoods like Rockridge and Montclair. That pullback shows up first in the segment of the market competing most directly with San Francisco commuters.
Layoffs and hiring freezes across Bay Area tech over the past couple of years reduced the number of dual-income households able to stretch into Oakland’s higher price tiers. That’s a meaningful piece of why demand has softened at the upper end of the single-family market, even as more affordable neighborhoods hold up comparatively well. Income growth outside tech, in healthcare and public-sector jobs concentrated in Oakland itself, has been steadier, which helps explain why some flatland and mid-tier neighborhoods haven’t seen the same pressure as pricier hillside areas.
Condos, Multi-Family, and Townhouses: Not All Property Types Move Together
The condo-versus-single-family split gets most of the attention, but Oakland’s multi-unit and townhouse segments have their own distinct patterns worth understanding separately.
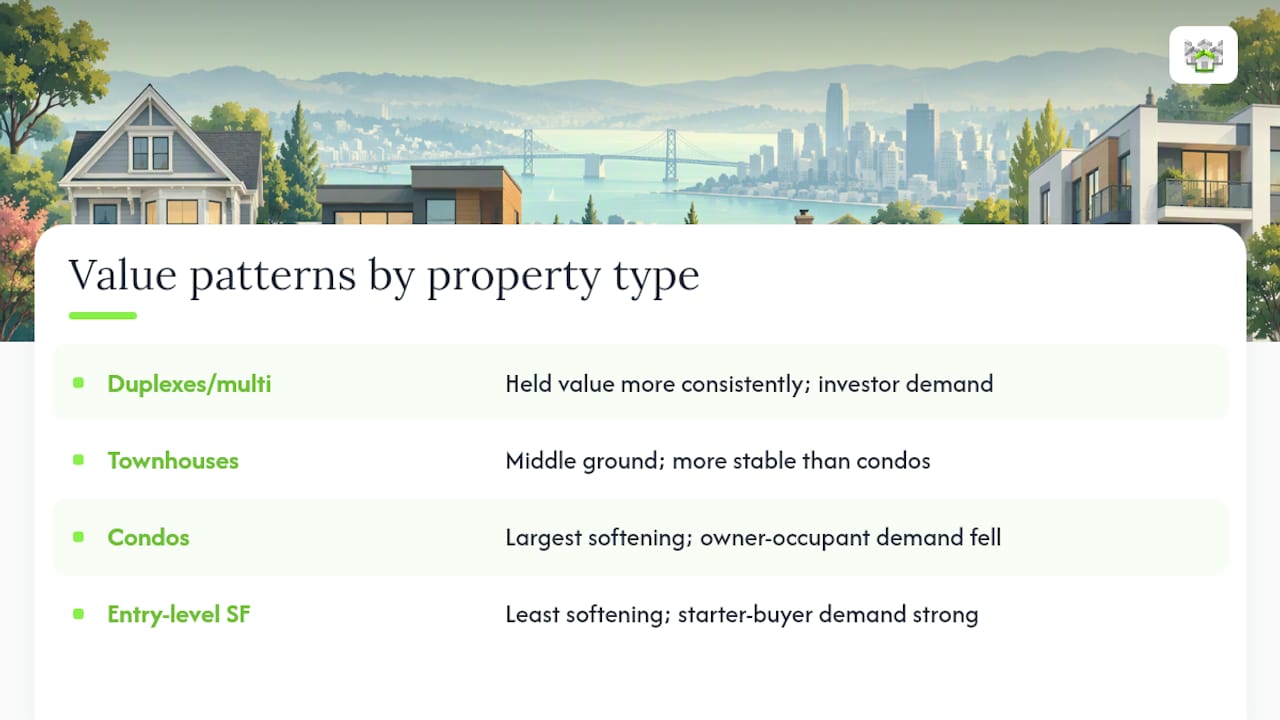
Duplexes and small multi-unit buildings have held value more consistently than condos through this correction, largely because investor demand for rental income properties hasn’t dropped as sharply as owner-occupant demand for condos. Buyers pursuing duplex and multi-unit properties are often underwriting based on rental income and cap rates rather than pure appreciation, which insulates that segment somewhat from the swings hitting owner-occupied condo values.
Townhouses occupy a middle ground. They typically carry lower HOA costs than high-rise condos and offer more of the space and privacy buyers want, which has kept townhouse pricing more stable than stacked-flat condos in most Oakland zip codes. Single-family homes at the entry-level price point have seen the least softening of any category, since first-time buyer demand for starter homes remains strong even as higher price tiers cool. The pattern across every property type points to the same conclusion: broad citywide statistics blend categories that are behaving quite differently from each other right now.
Ready to Act on Oakland’s Market? Here’s Our Take
The most useful thing anyone can do with Oakland’s housing headlines right now is stop treating the citywide number as a verdict. It’s a starting point.
Conventional advice tells buyers to wait for prices to bottom out and tells sellers to panic about falling values. Both instincts miss what the data actually shows: tight inventory and fast sale timelines mean well-priced homes in strong neighborhoods aren’t sitting around waiting for buyers to feel confident again. The households winning right now are the ones acting on neighborhood-specific comps rather than a citywide average, whether that means a buyer moving decisively on a fairly priced Rockridge listing or a seller pricing a Montclair home to what actually closed last month, not what a headline suggests.
If you take one thing from this, prioritize local data over national narrative. A citywide percentage tells you almost nothing about what your specific transaction should look like.
— Kenneth
Sources
- Oakland home values drop more than 11% over past year, marking one of steepest declines in nation
- Real Estate Market Trends in Oakland, CA: Prices Fall
- Terner Center analysis on Bay Area housing heterogeneity
FAQ
Are Home Prices Dropping in Oakland?
Yes. Zillow data reported in May 2026 shows Oakland’s typical home value fell about 11.4% year-over-year to roughly $716,000.
What Are the Predictions for the Oakland Housing Market?
Forecasts vary widely and carry real uncertainty, with some models pointing to modest month-to-month stabilization after the recent decline. Given the gap between different data sources on how much Oakland has actually softened, any specific forecast should be treated as a rough guide rather than a guarantee.
Are Home Prices Dropping in the Bay Area?
Broadly, yes. Rate pressure and affordability constraints have softened prices across most Bay Area cities, not just Oakland, though the size of the decline varies significantly by city and by housing type. Oakland’s decline appears larger than some neighbors partly because of its higher share of condo inventory.
Which Neighborhood in Oakland Is the Wealthiest?
Crocker Highland ranks among Oakland’s wealthiest neighborhoods, with a median household income near $238,126. Panoramic Hill, Montclair, and Hiller Highlands also rank among the city’s highest-income and highest-value areas.